
For B2B companies
Know your customers. Prove your commercial ROI.
DigitalMatch gives B2B companies one place to read accounts, pipeline and customer feedback against competitors, and to prove commercial ROI.
Accounts, pipeline and customer feedback, read against competitors and the market.
Start in 5 minutes with the data you already have. Then make it governed and scalable.

The problem
Pipeline in the CRM. Feedback in surveys. The story in nobody's hands.
- 01
Account KPIs, pipeline and campaign results sit in separate tools.
- 02
Customer feedback is collected but never correlated with revenue.
- 03
Proving commercial ROI to the C-level takes days of manual work.
- 04
Competitor signals arrive late, if at all.
The solution
Four levels of intelligence. One engine.
Level 1 · Market intelligence
DigitalMatch Intelligence
Access DigitalMatch's global knowledge base: market trends, customer dynamics and competitive signals across 7 global regions. Ask a question, get a strategic answer.
Competitor signals and market dynamics in your sectors.
Start freeLevel 2 · Your proprietary data
My Intelligence
Drag and drop reports, KPIs, surveys, sales files, campaign results and retail data in any format (Excel, PDF, CRM exports), or open the API. The AI analyses, correlates and answers in plain language, in seconds.
Upload customer segments, account-level KPIs, pipeline exports and feedback.
Start freeLevel 3 · Data visualization
Dashboard
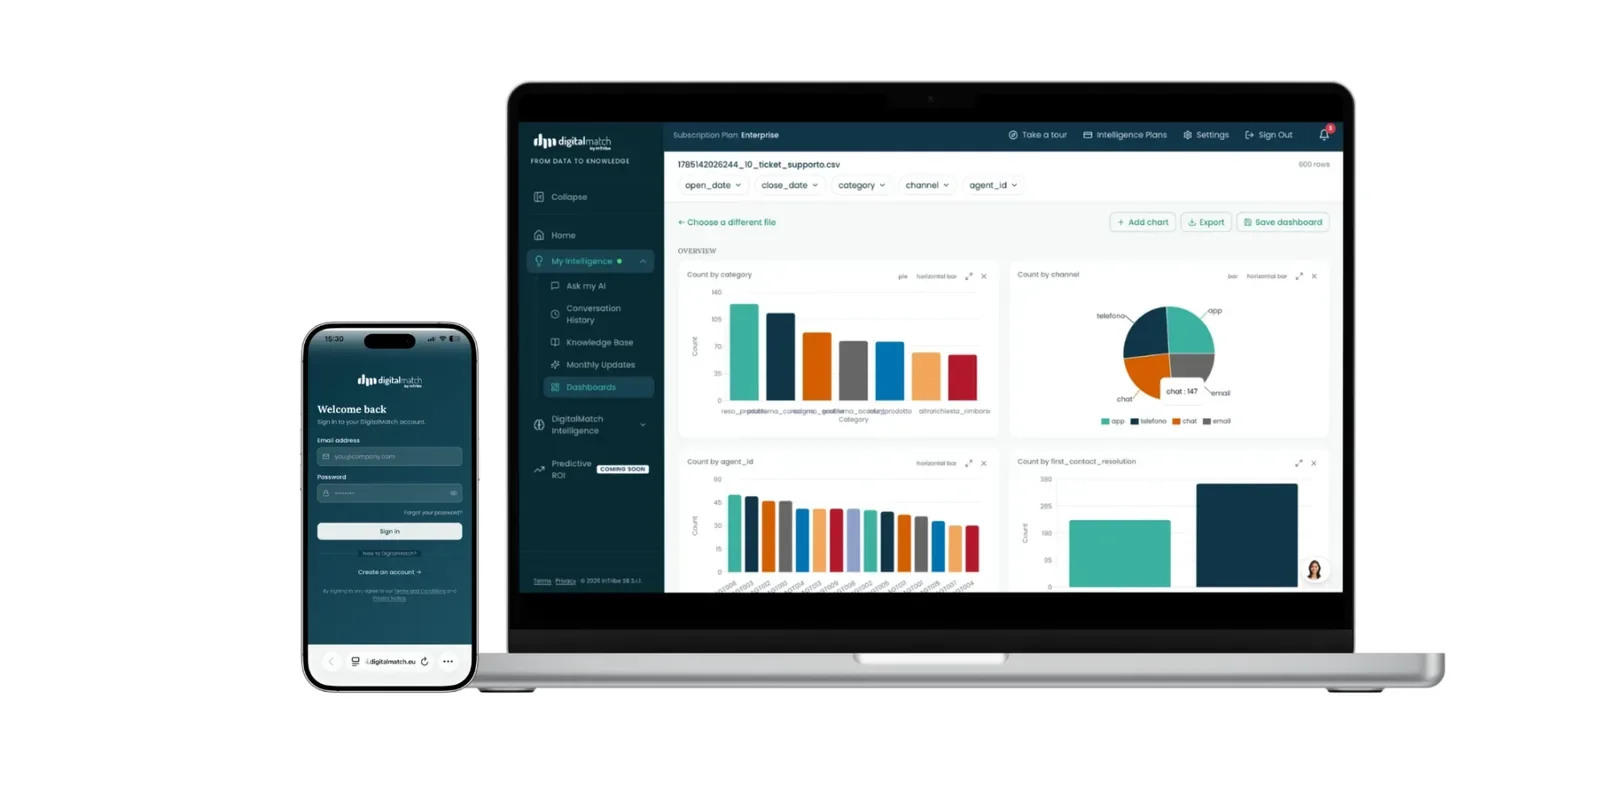
A dynamic dashboard that structures whatever you upload into metrics, charts and breakdowns, filtered by KPI, segment and period. Export as PDF and PPT for C-level reporting. Activate monthly updates to get a fresh report every month.
Accounts, segments and pipeline by period, ready for the management meeting.
Start freeLevel 4 · Forward-looking guidance
Predictive ROI
A proprietary predictive model that correlates marketing, sales and communication activities with business results across all touchpoints. See where budget is wasted and where to move it.
Which commercial and marketing activities generate pipeline and retention.
Start free
From pipeline to proven commercial ROI.
Account KPIs, campaigns and customer feedback, correlated with business results and read against competitors.
Example questions
Ask it like you'd ask a colleague.
Plain language in. A clear answer, with the data behind it, out.
How it works
Three steps. Five minutes to start.
Upload your data or open the API
No technical integration required.
Ask your question in plain language
Example: “Which segment has the highest churn risk?”
Make decisions
Algorithms show the what, AI explains the why, the dashboard makes it shareable with the C-level.
Proof
Real decisions, measured.
Case study
Media and publishing company
- Challenge
- For years we delivered a continuous survey and correlated the company's data with market signals as periodic reports. Questions raised in meetings had to wait for the next report.
- Solution
- Moved to an always-on Enterprise SaaS, queryable on demand in plain language.
- Results
- 4x faster strategic decisions
- Market-research turnaround from 3 weeks to seconds
- One view across sales, marketing, communication and awareness KPIs
Next step: Predictive ROI.
10 years
of R&D
80+
proprietary algorithms
200+
predictive indices
TRL7
deep tech
+8-15%
marketing ROI*
+20-30%
revenue uplift*
Up to 20x
faster decisions*
>70%
saved on survey costs*
* Measured on real decisions.
Security
European by design.
Hosted in Frankfurt
All data stays in Europe and never leaves the EU.
Encrypted per workspace
Every document encrypted at upload with a dedicated key. Workspaces isolated at database level.
Zero data retention
Models run in Zero Data Retention mode. Client data is never used to train AI.
GDPR compliant
We have no access to file content. European by design.
FAQ
How is DigitalMatch different from a standard dashboard or BI tool?
A BI tool typically needs reports to be built in advance. With DigitalMatch you ask questions in plain language, the algorithms show the what and the AI explains the why. The dashboard is built automatically from whatever you upload, and your data is read against market intelligence.
What does the market knowledge base add to my own data?
It is our global knowledge base: market trends, customer dynamics and competitive signals across 7 global regions, built on 10 years of research. Your numbers are read against it, so you can understand your results in the context of the market.
How does Predictive ROI work, and what data does it need?
Predictive ROI is a proprietary predictive model that correlates your marketing, sales and communication activities with business results across all touchpoints. It shows where budget is wasted and where to invest next. It needs the KPIs of your activities and of your results. Together we check which data you already have and what is missing.
How is ROI measured across channels, brands and markets?
The model is omnichannel, so it looks at all touchpoints. For groups with several brands or business areas, ROI is calculated separately for each unit. You then get views by brand, by business area and for the whole group, all based on common rules.
See what your data says about your next decision.
Start in 5 minutes with the data you already have, or book a call with our senior team.