
For HR
Your HR strategy creates value. Prove it in a few clicks.
DigitalMatch lets HR teams read their KPIs and people feedback against the external labour market, and show the value of HR to the C-level.
HR KPIs, people feedback and the external labour market, in one platform.
Start in 5 minutes with the data you already have. Then make it governed and scalable.

The problem
HR creates value. The numbers don't show it yet.
- 01
HR KPIs in one system, qualitative feedback in another.
- 02
Reports take days.
- 03
No comparison with the external labour market.
- 04
HR is seen as a cost centre because KPIs are not translated into financial results.
The solution
Four levels of intelligence. One engine.
Level 1 · Market intelligence
DigitalMatch Intelligence
Labour market trends, salary benchmarks and sector dynamics from DigitalMatch's knowledge base.
Start freeLevel 2 · Your proprietary data
My Intelligence
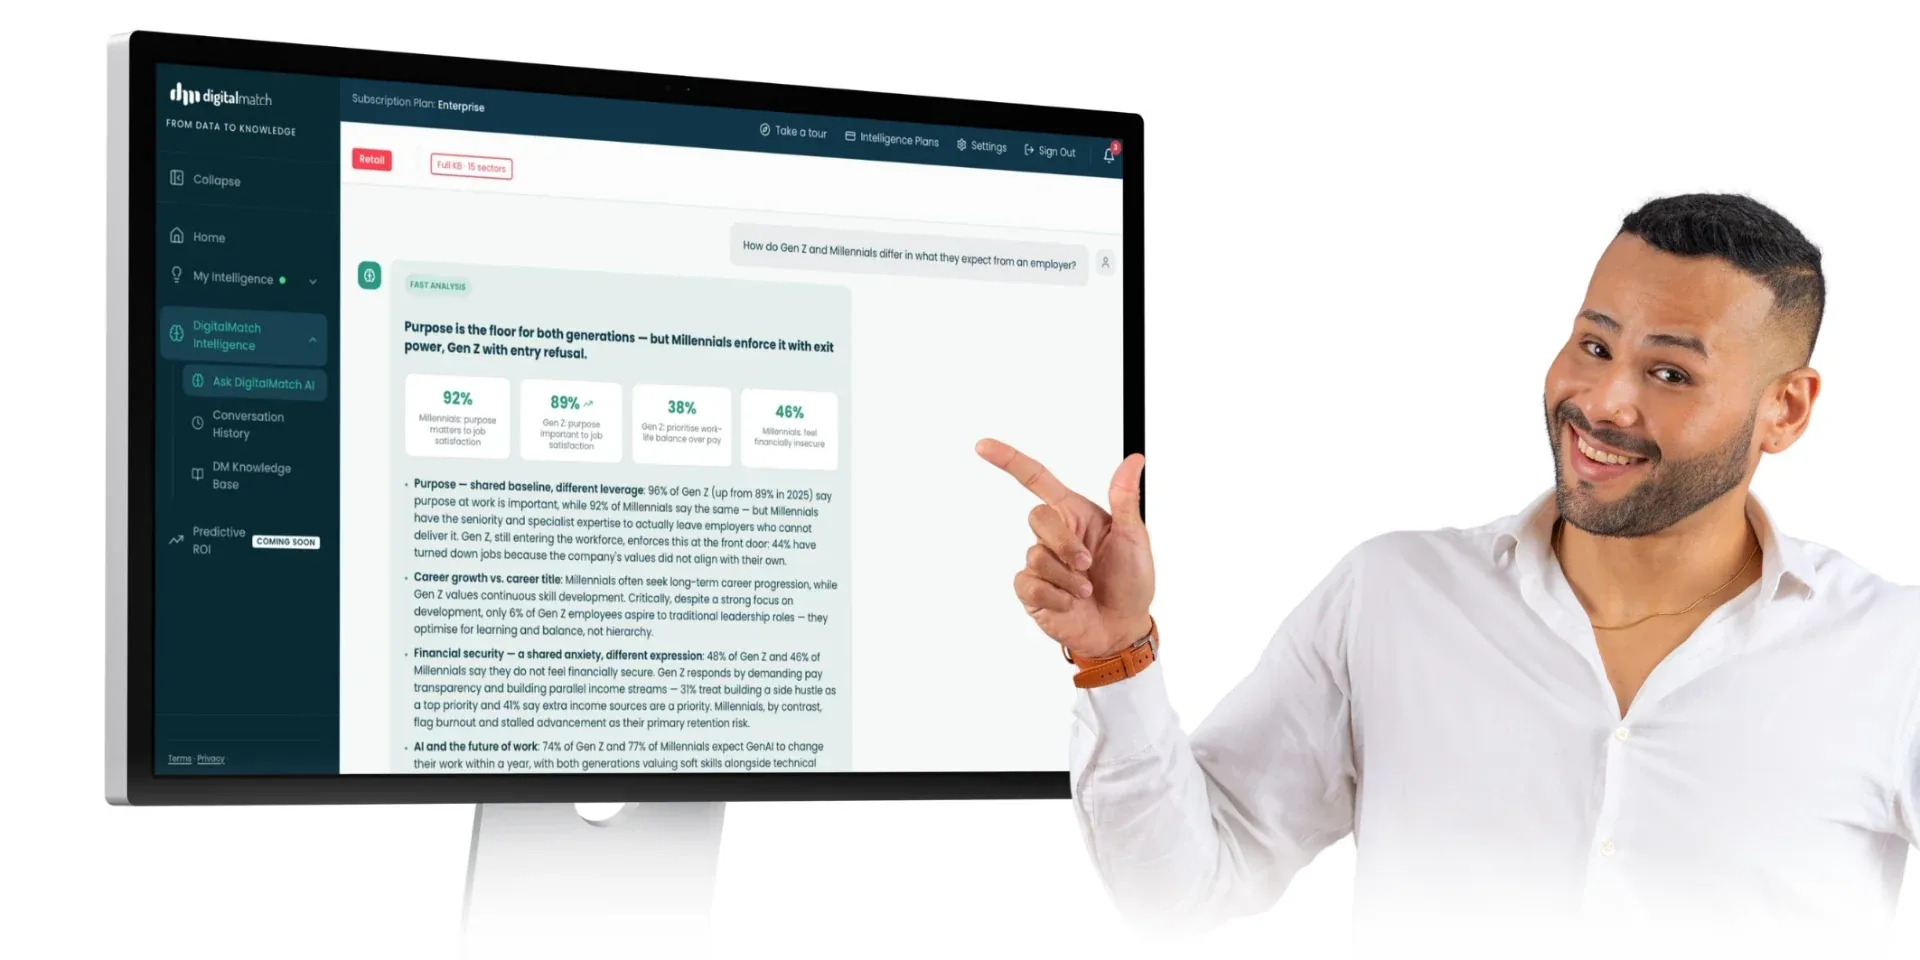
Upload engagement surveys, training access records and Excel files. Ask questions in plain language.
Start freeLevel 3 · Data visualization
Dashboard
Attrition, gender and age distribution, hiring trend and salary benchmark by department. Export to PDF and PPT.
Start freeLevel 4 · From KPI to ROI
Predictive ROI
Correlate HR initiatives with business results, so HR KPIs speak the language of finance.
Start free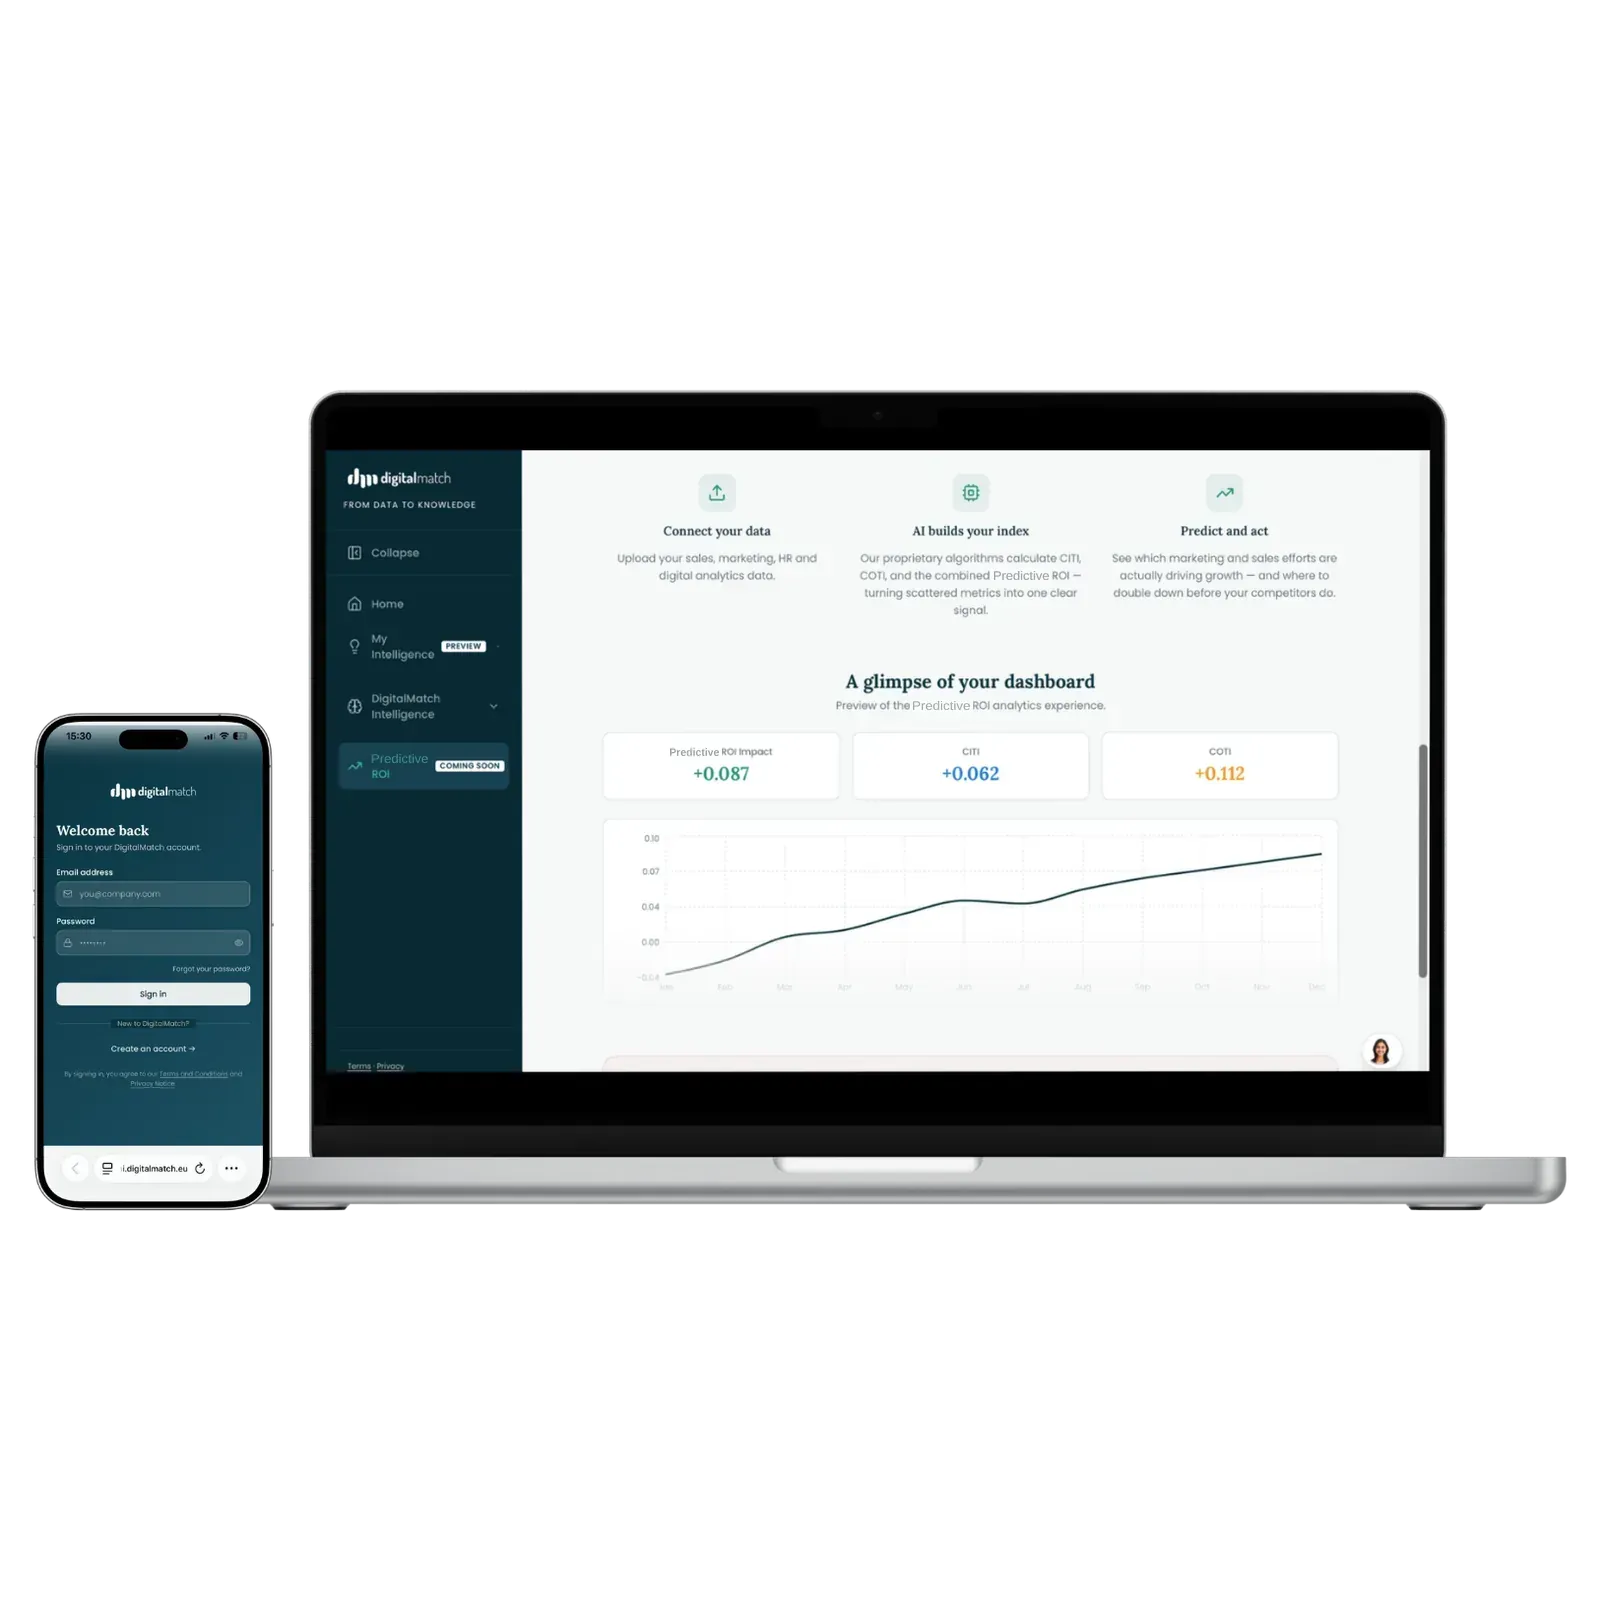
Translate HR KPIs into business results.
Compare your people data with the labour market and show how HR initiatives correlate with retention and value.
How it works
Three steps. Five minutes to start.
Upload your data or open the API
No technical integration required.
Ask your question in plain language
Example: “Which segment has the highest churn risk?”
Make decisions
Algorithms show the what, AI explains the why, the dashboard makes it shareable with the C-level.
Example questions
Ask it like you'd ask a colleague.
Plain language in. A clear answer, with the data behind it, out.
Market intelligence
DigitalMatch Intelligence
Labour market trends, salary benchmarks and sector dynamics from DigitalMatch's knowledge base.
Your proprietary data
My Intelligence
Upload engagement surveys, training access records and Excel files. Ask questions in plain language.
Data visualization
Dashboard
Attrition, gender and age distribution, hiring trend and salary benchmark by department. Export to PDF and PPT.
From KPI to ROI
Predictive ROI
Correlate HR initiatives with business results, so HR KPIs speak the language of finance.
10 years
of R&D
80+
proprietary algorithms
200+
predictive indices
TRL7
deep tech
Security
European by design.
Hosted in Frankfurt
All data stays in Europe and never leaves the EU.
Encrypted per workspace
Every document encrypted at upload with a dedicated key. Workspaces isolated at database level.
Zero data retention
Models run in Zero Data Retention mode. Client data is never used to train AI.
GDPR compliant
We have no access to file content. European by design.
FAQ
Which HR topics can I analyse?
You can analyse attrition and turnover by department, hiring trends, gender and age distribution, training participation, employee surveys and salary benchmarks, and read them against the external labour market.
What are HR ROI, DEIA ROI and H&S ROI?
HR ROI shows whether decisions about people bring a positive or negative result for the company. It reads what happens inside (selection, retention, training, employee perceptions) and how the company is seen from outside. DEIA ROI shows whether one or more groups of people (by gender, age, disability, caregiving) are penalised compared with the rest of the company, and on which topic. H&S ROI measures health, safety and wellbeing. It combines data on injuries, checks and training with employee perceptions, to spot risks before they become problems.
How can HR show the value of its initiatives to the C-level?
DigitalMatch connects HR KPIs and qualitative feedback to business results and turns them into ROI readings. The dashboard can be exported as PDF and PPT for C-level reporting.
How is data protected?
Every document is encrypted at the moment of upload, with a key dedicated to your workspace. That key never leaves the platform. Workspaces are isolated at database level, so we have no access to the content of your files. The platform is hosted in the EU and is GDPR compliant.
See what your data says about your next decision.
Start in 5 minutes with the data you already have, or book a call with our senior team.