
For retail
Every store has a story. Ask it.
With DigitalMatch, retailers can ask why one store grows and another stalls, using POS, loyalty, reviews and sell-out data together with campaigns and market trends.
POS, loyalty, reviews and sell-out, connected to your campaigns and to the market.
Start in 5 minutes with the data you already have. Then make it governed and scalable.

The problem
Store data is scattered. Explanations are missing.
- 01
POS, loyalty, reviews and store data are scattered.
- 02
No way to explain why one location grows and another stalls.
- 03
Sell-in and sell-out are not connected to marketing activity.
The solution
Four levels of intelligence. One engine.
Level 1 · Market intelligence
DigitalMatch Intelligence
Access DigitalMatch's global knowledge base: market trends, customer dynamics and competitive signals across 7 global regions. Ask a question, get a strategic answer.
Local market trends and competitor presence around your stores.
Start freeLevel 2 · Your proprietary data
My Intelligence
Drag and drop reports, KPIs, surveys, sales files, campaign results and retail data in any format (Excel, PDF, CRM exports), or open the API. The AI analyses, correlates and answers in plain language, in seconds.
Upload POS, loyalty, reviews and sell-in / sell-out files.
Start freeLevel 3 · Data visualization
Dashboard
A dynamic dashboard that structures whatever you upload into metrics, charts and breakdowns, filtered by KPI, segment and period. Export as PDF and PPT for C-level reporting. Activate monthly updates to get a fresh report every month.
Performance by store, cluster, city and period, exported for the board.
Start freeLevel 4 · Forward-looking guidance
Predictive ROI
A proprietary predictive model that correlates marketing, sales and communication activities with business results across all touchpoints. See where budget is wasted and where to move it.
Which promotions and campaigns move sell-out, store by store.
Start freeStore by store
Read every location against the market.
Store performance, promotions and campaigns, connected in one view. Start with your POS export.
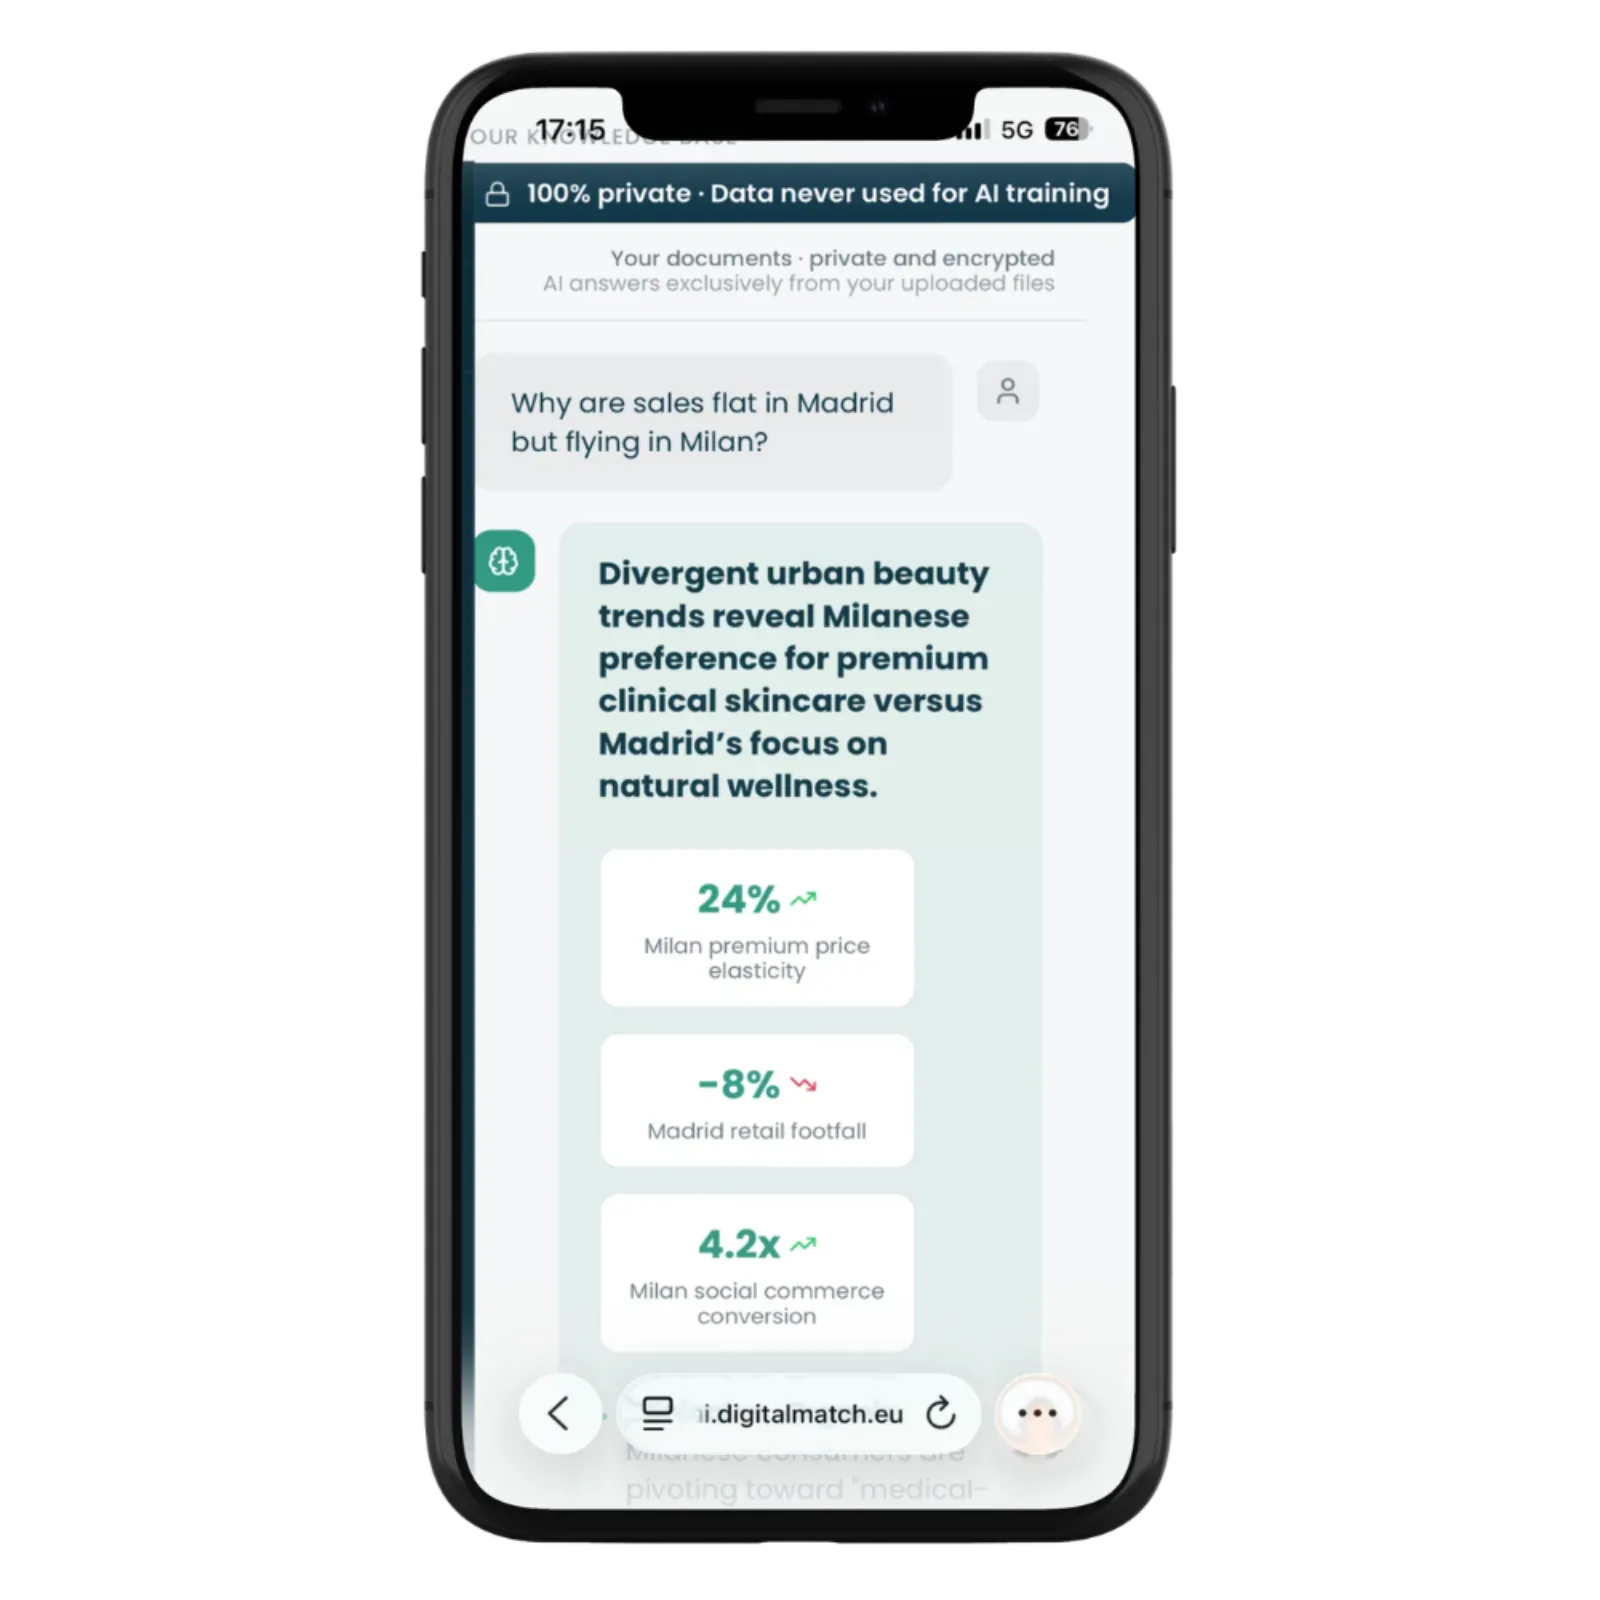
“Why are sales stable in Madrid and growing in Milan?”
Example questions
Ask it like you'd ask a colleague.
Plain language in. A clear answer, with the data behind it, out.
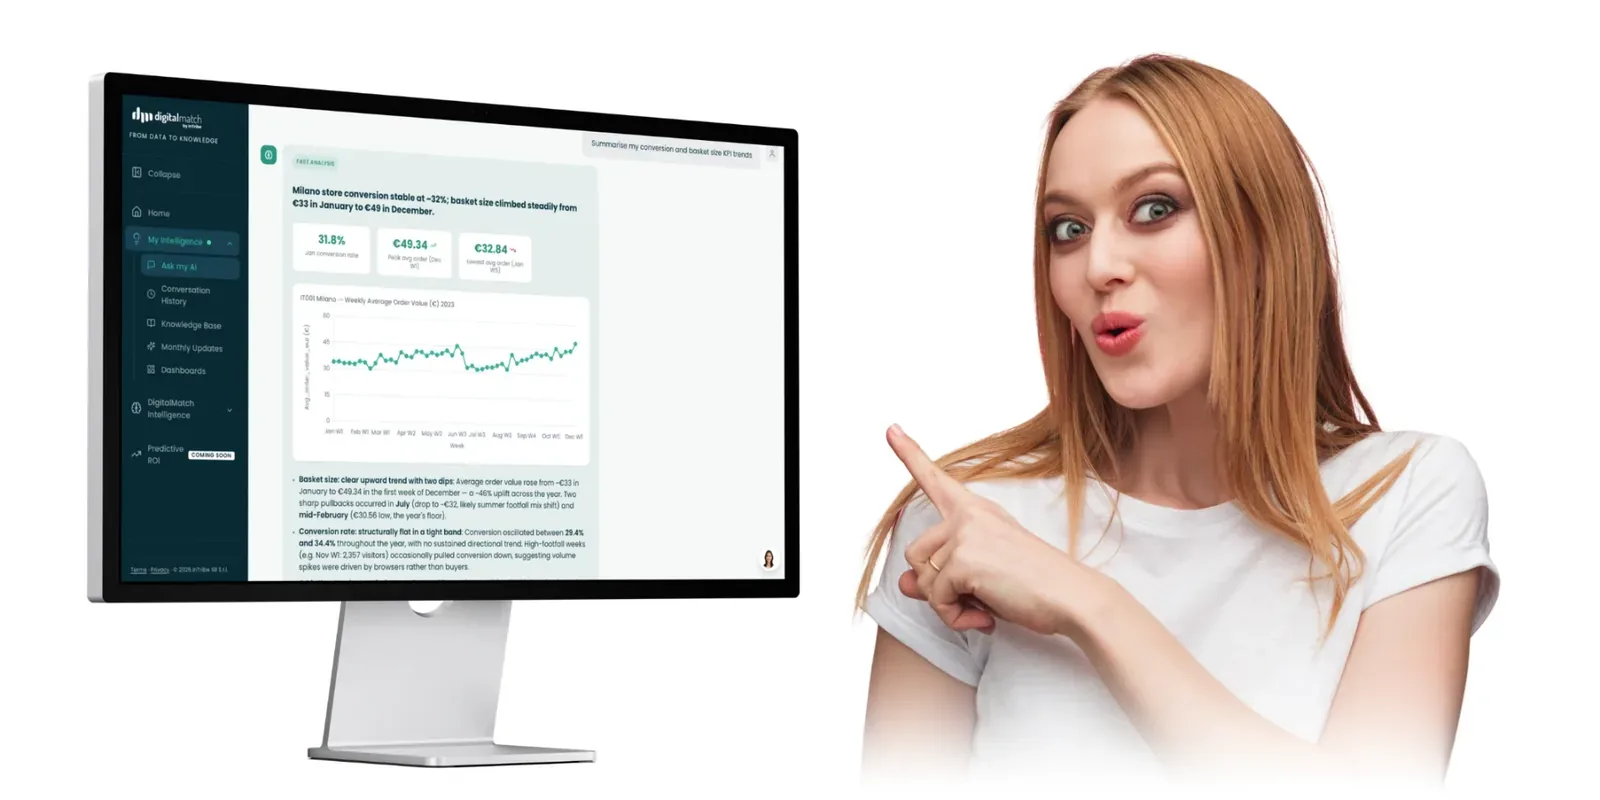
How it works
Three steps. Five minutes to start.
Upload your data or open the API
No technical integration required.
Ask your question in plain language
Example: “Which segment has the highest churn risk?”
Make decisions
Algorithms show the what, AI explains the why, the dashboard makes it shareable with the C-level.
Proof
Real decisions, measured.
Case study
Global high jewellery maison
- Challenge
- Owned-channel analytics, online presence, influencer performance and purchase data lived in different tools and teams, each with its own metrics. The data was there; a single narrative was not.
- Solution
- A continuous data governance and data intelligence: harmonised sources and metrics, proprietary KPIs, correlation of quantitative KPIs with qualitative information, constant benchmarking against the market and competitors.
- Results
- 4 years of continuous KPI and insight monitoring
- 63 reports per year, 6 geographic macro-areas
- 5 social channels monitored with competitor benchmarking
- One single narrative, always read against competitors and trends
Legacy: The method became the one we use today for data intelligence in complex organisations.
10 years
of R&D
80+
proprietary algorithms
200+
predictive indices
TRL7
deep tech
+8-15%
marketing ROI*
+20-30%
revenue uplift*
Up to 20x
faster decisions*
* Measured on real decisions.
Security
European by design.
Hosted in Frankfurt
All data stays in Europe and never leaves the EU.
Encrypted per workspace
Every document encrypted at upload with a dedicated key. Workspaces isolated at database level.
Zero data retention
Models run in Zero Data Retention mode. Client data is never used to train AI.
GDPR compliant
We have no access to file content. European by design.
FAQ
Which retail data can I use, and do I need to integrate my POS?
You can upload sales files, POS and loyalty exports, reviews and store data, in any format. No technical integration is needed. You can also open the API.
Can DigitalMatch explain why one store grows and another stalls?
Yes. DigitalMatch correlates store data (sales, loyalty, reviews) with campaigns and market trends. You can ask, for example, why sales are stable in one city and growing in another, and get an answer in seconds.
Can I compare stores and countries, for example a new opening against the market?
Yes. You can compare store performance across locations and countries, and read the ramp-up of a new store against market signals.
How do sell-in and sell-out data connect to marketing activity?
You can upload sell-in and sell-out data together with campaign results and market data. DigitalMatch correlates them, so you can see which marketing activities are linked to sales results.
See what your data says about your next decision.
Start in 5 minutes with the data you already have, or book a call with our senior team.